The deeper problem isn't the losses. It's that most teams don't know why they lost, which opportunities they should have skipped, or whether their Go/No-Go decisions actually predicted outcomes. Without structured analytics across the BD and proposal lifecycle, teams repeat the same losing patterns on the next bid and the one after that.
This article lays out what proposal analytics actually means in GovCon, which metrics matter, how the process works step by step, and how platforms like Intellectible are compressing the time it takes to surface those insights.
Key Takeaways
- 75% of GovCon contractors win 50% or less of pursued opportunities — analytics is how high performers break out of that range
- Go/No-Go scoring, PWin tracking, and price-to-win analysis are the three highest-leverage analytical inputs
- Post-award debriefs are the most underused data source in most proposal shops — and usually the most actionable
- AI-mature GovCon firms win more than 50% of award pursuits, per the 2026 GAUGE survey of 1,204 professionals
- Closing the feedback loop between debrief data and scoring models is where compounding win-rate improvement happens
What Is Proposal Analytics in Government Contracting?
Proposal analytics in GovCon is the practice of collecting, measuring, and interpreting data at each stage of the BD and proposal lifecycle — from opportunity identification through award notification — with the specific goal of improving future win rates.
This is different from commercial proposal tracking, where "analytics" often means open rates, click tracking, or time-spent-on-document metrics. In GovCon, the document was read. The question is whether evaluators scored it higher than the competition.
Three Layers of GovCon Proposal Analytics
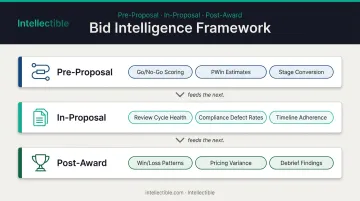
| Layer | When It Happens | What It Measures |
|---|---|---|
| Pre-proposal | Pipeline qualification | Go/No-Go scoring accuracy, PWin estimates, opportunity stage conversion |
| In-proposal | Active development | Review cycle health, compliance defect rates, submission timeline adherence |
| Post-award | After notification | Win/loss patterns by agency/vehicle, pricing variance from award price, debrief findings |
Each layer feeds the next. Pre-proposal decisions shape where resources go; in-proposal data tracks how well those resources are used; post-award findings close the loop — revealing whether your PWin estimates and positioning assumptions were accurate enough to trust next time.
Why Proposal Analytics Is Critical for GovCon Win Rates
Without analytics, Go/No-Go decisions default to gut instinct. Teams chase low-PWin opportunities because they're familiar with the agency, because the contract value looks attractive, or because leadership has conviction without data to back it up. Every hour spent writing a proposal that was never winnable is an hour not spent on one that was.
That cost accumulates quietly. Analytics exposes where it's hiding — and which decisions are driving it.
Patterns Analytics Reveals
- Win/loss by agency: Some agencies consistently evaluate on price; others reward solution differentiation. Teams without this data treat every agency the same.
- Win/loss by contract type: Your IDIQ win rate and your full-and-open competitive win rate may look nothing alike — but you won't know unless you track them separately.
- Price positioning: Teams that don't compare their proposed prices against historical award prices routinely overbid winnable opportunities or underbid and leave margin on the table.
- Review quality trends: Recurring compliance gaps in evaluated proposals rarely show up in post-award debriefs as isolated incidents. They're usually patterns — the same deficiency surfacing across multiple bids — that only analytics reveals.
The Review Cycle Dimension
Red Team reviews exist to predict how evaluators will score a proposal — flagging gaps in customer focus, completeness, and compliance before submission. Most proposal shops run them. Few track what they find. Fewer still ask whether the same findings keep coming back across bids. Identifying repeat Red Team defects is one of the highest-leverage improvements a proposal shop can make, and it's invisible without data.
Key Metrics GovCon Proposal Teams Should Track
No single number tells the story. Win rate improvement comes from monitoring a connected set of metrics across the full pursuit lifecycle.
Core Pursuit Metrics
- Go/No-Go score accuracy — Did bid decisions correlate with actual outcomes? If you're winning 80% of "high confidence" pursuits and 10% of "low confidence" ones, the model is working. If not, it needs recalibration.
- Bid-to-win ratio by opportunity type — Segment by agency, competition type, and vehicle. A 40% overall win rate can hide a 15% rate on new business beneath a 70% rate on recompetes.
- PWin estimate vs. actual outcome — Tracked over time, this reveals whether your team's PWin calls are optimistic, conservative, or well-calibrated.
- Pricing variance from award price — Tracked post-award, the gap between your proposed price and the winning price directly sharpens future price-to-win analysis.
- Proposal submission cycle time — Consistent tracking reveals whether teams have enough runway or are routinely compressing final reviews.
Pursuit-level metrics tell you how well you compete. Pipeline metrics tell you whether you're competing for the right things.
Supporting Pipeline Metrics
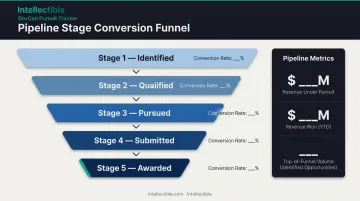
- Stage conversion rates: Identified → Qualified → Pursued → Submitted → Awarded
- Revenue under pursuit vs. revenue won — Reveals whether your pipeline is healthy or inflated with low-PWin pursuits
- Top-of-funnel volume — Are you seeing enough qualified opportunities, or pursuing everything because the funnel is thin?
How GovCon Proposal Analytics Works – Step by Step
Effective proposal analytics isn't a tool or a report — it's a structured process applied consistently across the BD lifecycle. Skipping any stage, particularly the post-award debrief loop, breaks the system.
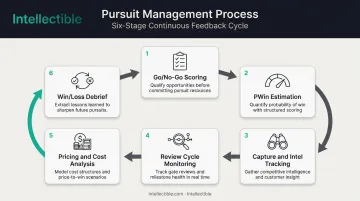
Step 1 – Qualify the Opportunity (Go/No-Go Scoring)
Use a structured scoring model to evaluate each opportunity against defined criteria before committing proposal resources. Per APMP's gate decision framework, those criteria should include strategic fit, customer relationship, competitive position, solution/delivery capability, resource availability, risk, and financial attractiveness.
The most common failure: treating Go/No-Go as a binary gut-check rather than a scored, data-backed decision. The second most common failure: never tracking whether Go decisions actually predicted wins, which is itself a critical analytics input.
Step 2 – Estimate Probability of Win (PWin)
Shipley defines PWin as a metric for tracking and monitoring how likely an organization is to win an opportunity. Inputs should include customer relationship strength, understanding of requirements, solution differentiation, competitive intelligence on likely offerors, and incumbent status — all scored against defined criteria, not estimated by feel.
Assigning optimistic PWin scores early in capture and never updating them is where most shops go wrong. Static estimates distort pipeline forecasting and push resource decisions based on a snapshot, not current reality.
Step 3 – Track Capture and Intel Gathering
Log what actually happens during capture: agency meetings, confirmed customer pain points, competitor pricing patterns, teaming agreements formed, and requirements-shaping opportunities. The goal is tracking quality, not just volume.
High capture activity volume with low intelligence quality — lots of meetings, few confirmed insights — often predicts weak technical volumes later. Analytics on capture quality reveals that gap before the proposal starts.
Step 4 – Monitor the Proposal Review Cycle
Track review cycle completion rates, defect counts by volume (technical, management, past performance, price), time-to-resolve for Red Team findings, and compliance checklist completion.
More importantly, track which findings recur across multiple proposals. Recurring defects are systemic. One-off corrections won't fix them — process changes will.
Step 5 – Analyze Pricing and Cost Volume
Price-to-win analysis should be built into every cost volume, not done the night before submission. Per FAR 15.404-1, government price analysis references include:
- Comparisons with other proposed prices
- Historical prices paid for similar items
- Independent government cost estimates (IGE)
All three should feed directly into your PTW model.
Track proposed price vs. IGE, proposed price vs. eventual award price (post-award), and how your rates compare to competitor structures. Over time, that data tells you where you're consistently overbidding — and by how much.
Step 6 – Conduct Win/Loss Debriefs and Close the Loop
Under FAR 15.506, offerors can request a post-award debrief within 3 days of award notice, and agencies must respond within 5 days of receiving the request. Required debrief content includes:
- Significant weaknesses or deficiencies identified
- Evaluated ratings for each factor
- Price and technical scores
- Offeror ranking (if developed)
- Award rationale
This is the most underutilized data source in most proposal shops. Closing the loop means feeding debrief findings back into Go/No-Go criteria, PWin models, review checklists, and pricing assumptions — so every future proposal benefits from every past loss.
GovCon Proposal Analytics in Action: A Practical Walkthrough
Consider a mid-sized GovCon company approaching a recompete IDIQ where they are the incumbent. Without analytics, the instinct is comfort: We know this agency, we have past performance, we'll win.
Here's what analytics would change:
Go/No-Go stage: Competitive intelligence surfaced that a large integrator had recently won two adjacent contracts at this agency and had been positioning for this recompete. The team's historical Go/No-Go data showed a 20% win rate when a well-resourced new entrant was in the field. That context shifted the conversation from "obvious pursuit" to "pursue with eyes open and a stronger price."
Pricing stage: PTW analysis comparing proposed rates against historical award prices for similar IDIQ vehicles at this agency revealed that the incumbent's typical pricing was 8-12% above recent award prices from competitive bids. The team adjusted their cost volume structure before submission — based on data collected systematically across prior bids.
Review stage: Red Team defect tracking across the last four proposals showed a recurring weakness in the past performance volume: the team consistently cited relevant contracts but failed to quantify technical achievements in evaluator-meaningful terms. That pattern had appeared in two prior debrief reports. Nobody connected those dots until the data lived in one place.
Outcome: The team submitted a more competitive price, addressed the past performance gap proactively, and won the recompete. Relying on incumbency alone would have produced a compliant but uncompetitive proposal. The analytics didn't change what the team knew — they changed what the team did with that knowledge before submission.
How Intellectible Can Help
Intellectible is an AI build platform purpose-built to automate the GovCon proposal analytics process — from opportunity scoring and Go/No-Go decision frameworks to pipeline dashboards and pricing workflows — without adding headcount or managing disconnected tools.
Intellectible's platform generates Go/No-Go reports directly from uploaded solicitation documents. Those reports score fit, urgency, risk, contract terms, and capability match — grounded in actual solicitation content, not generic templates.
Competitive intelligence feeds into those decisions: bidder density assessments, incumbent mapping, award history comparisons, and market characterization all inform whether a pursuit is worth committing resources.
Oceus, a defense and technology contractor, implemented Intellectible and doubled the qualified opportunities it reviews each month. CEO Jeff Harman put it directly: "Now we're looking at more than double the qualified opportunities per week — about seven to eight opportunities a month making it through our threshold." The platform also surfaced a net-new pipeline customer through AI-generated outreach — exposure that, in Harman's words, "didn't exist before."
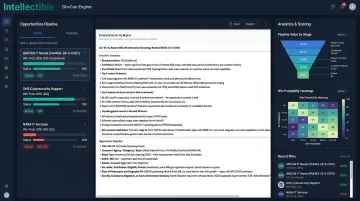
Beyond qualification, Intellectible's Proposal & Pursuit Engine addresses the downstream steps that stall submissions: it reads the RFP, attachments, and addenda to extract key dates, submission rules, required sections, evaluation criteria, and compliance obligations; turns requirements into a response plan with mandatory versus strategic sections, owners, deadlines, and status tracking; generates section drafts grounded in the RFP, deal variables, approved knowledge, and historical proposal language; and reviews the assembled proposal against requirements, strategy, tone, and missing evidence — with versioning and export in one controlled flow.
What distinguishes Intellectible from vertical proposal software is its horizontal architecture. Point-solution tools handle one slice of the proposal process in isolation. Intellectible’s systems — GovCon, Proposal/Pursuit, Pricing, CRM, and Knowledge — all run on the same platform and share the same data layer.
GovCon teams configure their own capture rules, scoring logic, routing workflows, and dashboards through a visual workflow builder, with no dedicated engineering resources required, to match their specific contract vehicles, agency focus areas, and review processes.
Conclusion
GovCon win rate improvement is fundamentally a data problem. Teams that instrument their BD and proposal lifecycle with structured analytics make better pursuit decisions, submit more competitive proposals, and learn faster from every bid outcome.
Proposal analytics isn't a one-time report either. Teams that systematically review and refine their Go/No-Go criteria, PWin models, pricing assumptions, and review processes compound that advantage with every proposal cycle.
Each debrief becomes input. Losses become calibration points. Over time, data-driven teams pull ahead of instinct-driven competitors — pursuing smarter opportunities, pricing sharper, and never repeating the same mistake twice.
Frequently Asked Questions
What is proposal analytics?
Proposal analytics is the practice of collecting and interpreting data across the BD and proposal lifecycle — from opportunity qualification through post-award debriefs — to identify patterns and systematically increase win rates. In GovCon, it covers bid qualification, pricing competitiveness, review cycle health, and win/loss pattern analysis, going well beyond document tracking.
What is a good win rate for government contractors?
There's no universal benchmark. Unanet's 2022 data shows 75% of surveyed contractors win 50% or less of pursuits, while the 2026 GAUGE survey associates AI-mature firms with winning more than 50%. Track bid-to-win ratio by opportunity type — segmented by agency, vehicle, and competition type — rather than relying on a single overall number.
What metrics should GovCon proposal teams track to improve win rates?
The highest-impact metrics are Go/No-Go score accuracy, bid-to-win ratio by opportunity type, PWin estimate vs. actual outcome, pricing variance from award prices, and review cycle defect rates. Together, they pinpoint where the BD and proposal process breaks down — at pursuit qualification, pricing, or proposal quality.
How does proposal analytics differ from capture management?
Capture management positions your team to win a specific opportunity. Proposal analytics measures performance data across many opportunities over time. The two work together: analytics informs capture strategy by revealing which opportunity types your team wins, at what price points, and against which competitors.
Can small GovCon businesses use proposal analytics to compete with larger primes?
Smaller GovCon companies often benefit most from proposal analytics because their BD resources are constrained. Data-driven Go/No-Go and PWin scoring helps them concentrate effort on winnable bids rather than spreading thin across too many pursuits — a meaningful leveler against larger competitors with bigger proposal teams and broader BD budgets.
How does AI improve GovCon proposal analytics?
AI automates the most time-consuming parts of proposal analytics — opportunity scoring, competitive intelligence synthesis, pricing data aggregation, and compliance gap detection — cutting decision timelines from days to hours. Platforms like Intellectible generate Go/No-Go assessments directly from uploaded solicitation documents, letting capture teams focus on strategy rather than data collection.