Introduction: What Signal-to-Pipeline Measurement Should Prove
Alert counts, intent spikes, and enrolled accounts look impressive on a slide. They prove almost nothing. Forrester reports that fewer than 1% of leads convert to closed deals, so activity volume is a weak stand-in for revenue.
A signal program is measurable only when a meeting or opportunity can be traced to the evidence and seller action that created it. CROs and RevOps need a reporting model for acceptance, first touch, meetings by signal type, sales-accepted opportunities, and pipeline, with clear denominators and attribution rules.
The path runs in five steps: define signal events, standardize the data, measure conversion and speed stage by stage, attribute outcomes carefully, and feed results back into scoring.
Key Takeaways
- Measure the full chain: signal, action, opportunity, pipeline, revenue, and time saved.
- Fix denominators, windows, and stage rules before calculating any rate.
- Rank signal types and stacks by pipeline quality, not volume.
- Use closed-loop reviews to retire noisy signals and sharpen scoring.
What Signal-to-Pipeline Measurement Means
Signals, stacked signals, and indicators
A signal is a time-stamped event or pattern that may point to a change in an account's priority, need, budget, intent, or competitive position. Examples include a leadership change, a funding round, a hiring surge, a federal pre-solicitation notice, or a pricing-page visit.
One weak event is a hint. A leadership change plus relevant hiring plus intent activity is a corroborated, stacked signal, and it deserves different treatment.
Leading indicators tell you whether the program is executing:
- Signal coverage and freshness
- Action rate and response rate
- Time to first touch
Lagging indicators tell you whether it paid off:
- Opportunities and pipeline value
- Win rate and revenue
- Sales-cycle length
Pick the objective first
Decide what the program is for before choosing metrics. Common goals include:
- Source new pipeline
- Influence open opportunities
- Accelerate stalled deals
- Improve qualification
- Cut the effort needed to find and pursue work
Each goal calls for a different primary metric. A program built to save research time should not be judged only on sourced revenue.
Build the Measurement Foundation Before Choosing Metrics
Define the signal taxonomy and event schema
Use a reporting model with four related records: signal event, account review, seller action, and opportunity outcome. Store owner, disposition reason, timestamps, and source identifier at each handoff. One account can have multiple signals, so define primary attribution and supporting signals without multiplying the pipeline value.
In Intellectible's Revenue Discovery Signal Monitor, for example, categories include Review Pain, Inspection Drop, Hiring Pressure, Funding Round, Leadership Change, Expansion, M&A, and Seasonality.
Every signal record should carry:
- Account or organization ID
- Signal type and source
- Event timestamp and detection timestamp
- Confidence or strength
- Related contact and owner
- Action taken and downstream outcome
Then map each category to a business problem. A new contract opportunity should trigger a pursuit response. A hiring pattern might trigger a capacity-focused message. Treating every event as equal is how noise wins.
Establish cohorts and denominators
Define the population behind every rate:
- Detected signals and qualified signals
- Accounts actioned and contacts reached
- Responses and meetings
- Opportunities, including those with accepted pipeline value
Set these rules before reporting:
- How long after a signal an opportunity counts as signal-sourced or signal-influenced
- Stage definitions and opportunity acceptance rules
- Pipeline amount rules
- How duplicate signals are treated
Keep signal date separate from opportunity creation date. Otherwise performance can appear to improve simply because the denominator changed.

Connect systems and audit data quality
Link CRM opportunities with marketing engagement, web activity, intent data, public-sector sources, proposal systems, and sales-engagement tools. Resolve account identities, deduplicate contacts, and preserve original timestamps.
Forrester's 2023 research warns that poorly maintained B2B data can misdirect sales and marketing and cost revenue opportunities.
Audit before you publish a baseline. Look for:
- Missing timestamps and stale stages
- Inconsistent amounts and unassigned owners
- Duplicate accounts
- Signals with no linked action or outcome
Measure Every Stage from Signal to Pipeline
Coverage, quality, and speed
Report by signal type and ICP segment, not just in aggregate:
- Target accounts monitored
- Signals detected and signals that meet qualification criteria
- Percentage routed to an owner or workflow
Speed matters as much as volume. Track event-to-detection, detection-to-assignment, and detection-to-first-action time. InsideSales found that conversion rates drop 8x after five minutes across a dataset of 5.7M inbound leads. That is a report-specific association, not a causal test, but it justifies tracking response time closely.
Track acceptance rate, time to first touch, meetings per signal type, sales-accepted opportunities, and pipeline per signal cohort. Define denominators explicitly: accounts submitted for acceptance are different from all raw events collected, and meetings are different from qualified sales opportunities.
Conversion from signal to opportunity
Calculate signal-to-response, signal-to-meeting, and signal-to-opportunity with documented denominators. For example, divide opportunities created from qualified signals by the qualified signals (or accounts actioned) in the same cohort.
Then slice the results by:
- Signal type and source
- Account segment, persona, and territory
- Campaign
- Single-signal versus stacked-signal exposure
6sense's 2024 benchmark found that 72% of organizations prioritize accounts with multiple leads, up from 61% in 2022, which supports testing stacked signals directly.
Treat outside benchmarks cautiously. Ebsta and Pavilion's 2025 report lists a 19% new-logo win rate and a 91-day average new-business cycle, but those figures come from one dataset. Your market, deal size, and signal definition may differ, so use them for context rather than targets.
Pipeline value and revenue outcomes
Track pipeline value by signal type, average pipeline per qualified signal, opportunity acceptance rate, stage progression, win rate, closed-won revenue, and cycle length.
Distinguish three categories:
- Sourced: the signal started the opportunity
- Influenced: the signal appeared during an open opportunity
- Accelerated: the signal coincided with faster stage movement
Document whether one opportunity may sit in more than one category. Where it fits, extend to gross margin, contract value, renewal, expansion, or time saved qualifying opportunities.
Build a cohort-based dashboard
Use separate views for signal activity, funnel conversion, pipeline contribution, velocity, and revenue. Group signals by week or month so young cohorts are not compared with mature ones. Annotate incomplete cohorts instead of labeling them failures.
Show the lag between detection, first action, meeting, opportunity, stage progression, and close. Give RevOps a drill-down from any headline number to the original signal, source evidence, actions, contacts, and opportunity record.

Attribute Pipeline and Evaluate Signal Quality
Match the attribution model to the question
Each model answers a different question:
| Model | Best for | Documented rule |
|---|---|---|
| First touch | Which signal started the opportunity | Adobe's First Touch credits the first awareness touchpoint |
| Last touch | The immediate trigger | HubSpot credits the last interaction before contact creation |
| Multi-touch | The combined journey | HubSpot's W-shaped model gives 30% each to first interaction, contact creation, and deal creation |
Vendor models define touchpoint credit, not sourced, influenced, or accelerated pipeline, so label those yourself. Influence is not proof of causation.
Score the predictive power of each signal
Score signals consistently on:
- ICP fit
- Recency
- Specificity
- Intensity
- Corroboration
- Historical conversion to qualified pipeline
Compare single signals against stacks to see whether combinations outperform isolated events.
Track quality leaks as well:
- False positives
- Ignored signals
- Duplicate alerts
- Signals that produced activity but no qualified progression
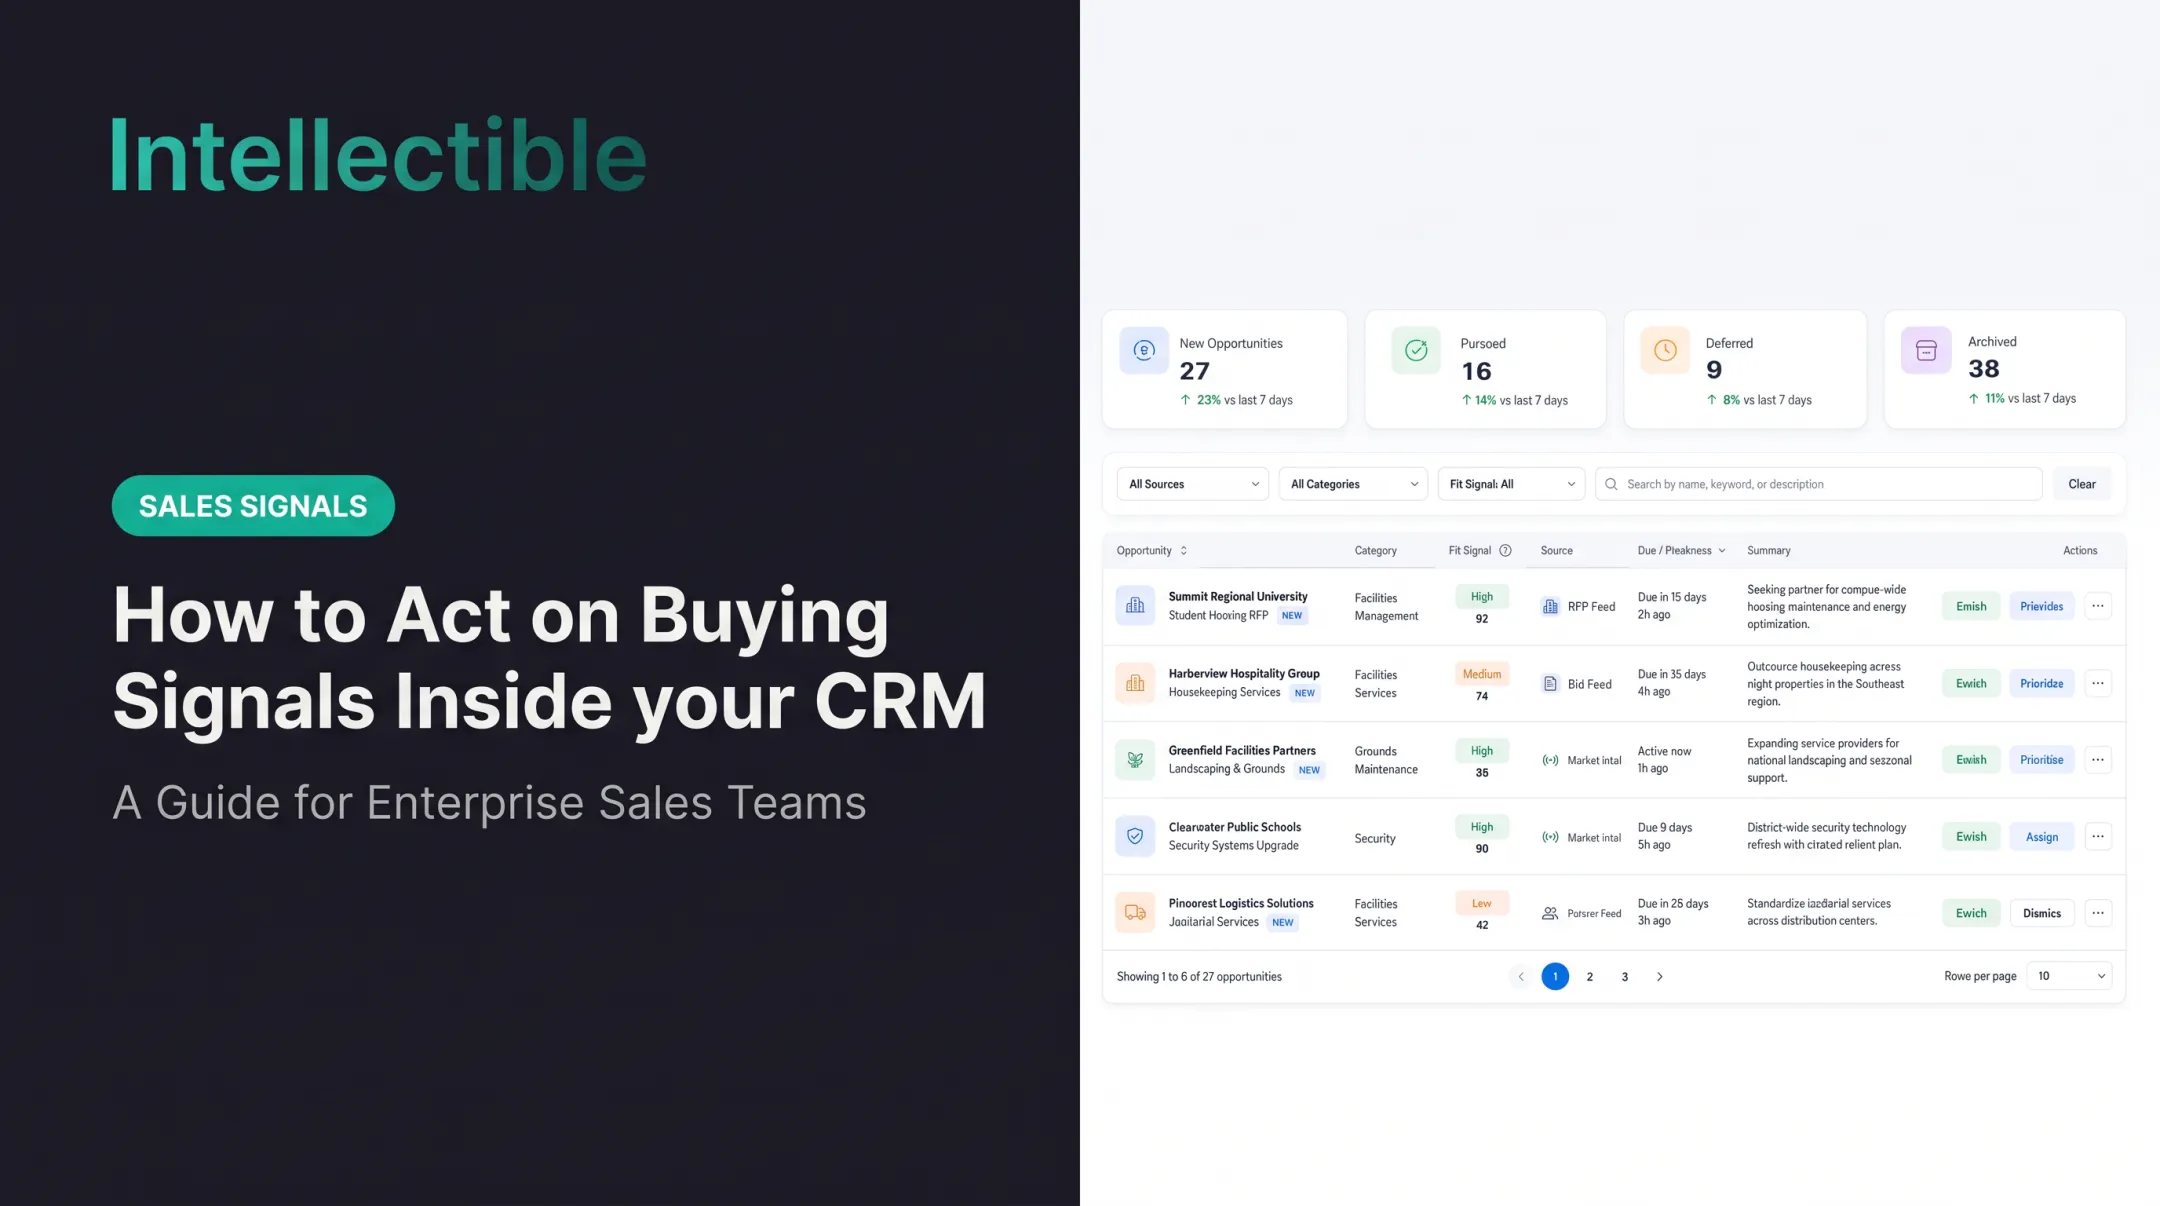
Intellectible's Opportunity Review Desk shows why this matters: one example view logs 16 opportunities pursued and 121 deleted, a reminder that most detected items get filtered out.
Compare cohorts and test incrementality
Compare outcomes across signal types, score bands, response-time bands, and action paths. Faster follow-up or a specific workflow may correlate with better results.
Correlation is not incrementality. The American Marketing Association's B2B experiments primer calls experiments the strongest design for causal questions while noting how hard random assignment is in B2B.
Where volume allows, use holdout or matched-account tests. Control for:
- Account size and territory
- Existing relationships
- Seasonality and campaign spend
- Whether the opportunity was already active before the signal
Close the loop to signal strategy
Feed acceptance, disqualification reasons, loss reasons, stage progression, and closed-won outcomes back into the signal record and scoring model.
A generic loop looks like this:
- A signal is detected and scored.
- It is routed to an owner and acted on.
- It links to an opportunity.
- Pipeline progression is measured.
- Results adjust the next scoring decision.
Hold a recurring review where RevOps retires low-value signals, changes thresholds, updates playbooks, and tests new combinations.
Operationalize Reporting and Close the Loop
Assign ownership and cadence
Spread responsibility. Different owners should hold signal definitions, data quality, routing, sales follow-up, opportunity hygiene, attribution logic, and executive reporting. One team owning every stage creates blind spots.
Review leading indicators often, since execution problems need fast correction. Review mature pipeline and revenue cohorts less often to avoid overreacting to incomplete data. Every report should end in a decision:
- Change a threshold
- Reassign accounts
- Fix a slow handoff
- Drop a noisy source
- Invest in a signal that keeps producing qualified pipeline
Automate detection to action
Automated workflows can capture signals, enrich records, score or stack events, route work, keep an audit trail, and escalate cases for human review. Intellectible is one example.
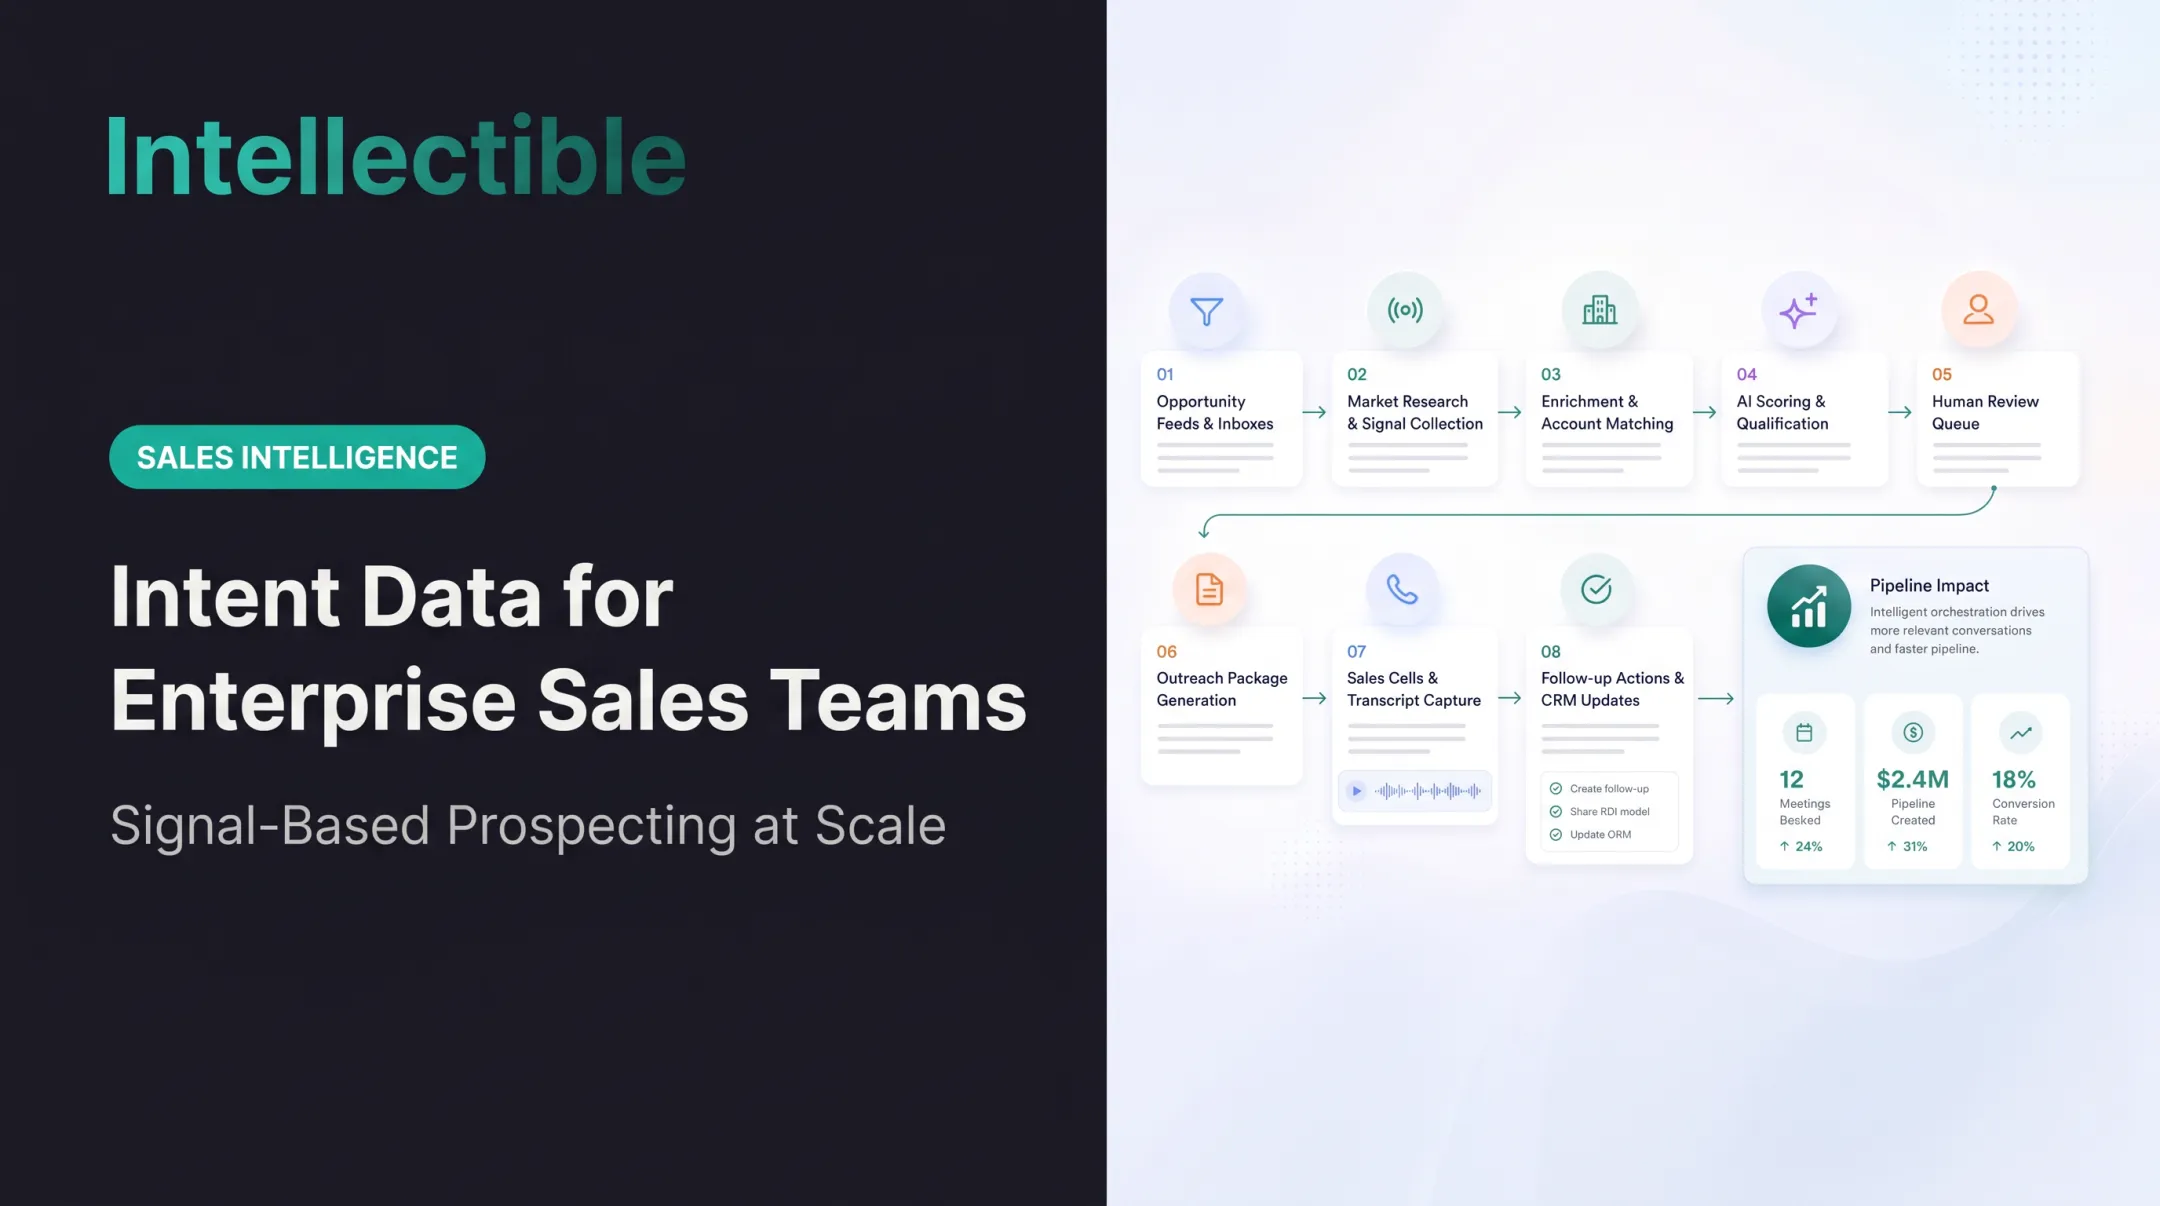
The Revenue Discovery Engine connects signal collection, enrichment and account matching, AI scoring, a human review queue, and CRM updates. A visual workflow builder, connected data, and interfaces let teams do this without rebuilding infrastructure for each workflow.
The Pipeline Impact panel shows the reporting end: 12 meetings booked, $2.4M pipeline created, and an 18% conversion rate. Approval gates require human sign-off before outreach, Salesforce updates, survey sends, and marking a lead Qualified for Costing.

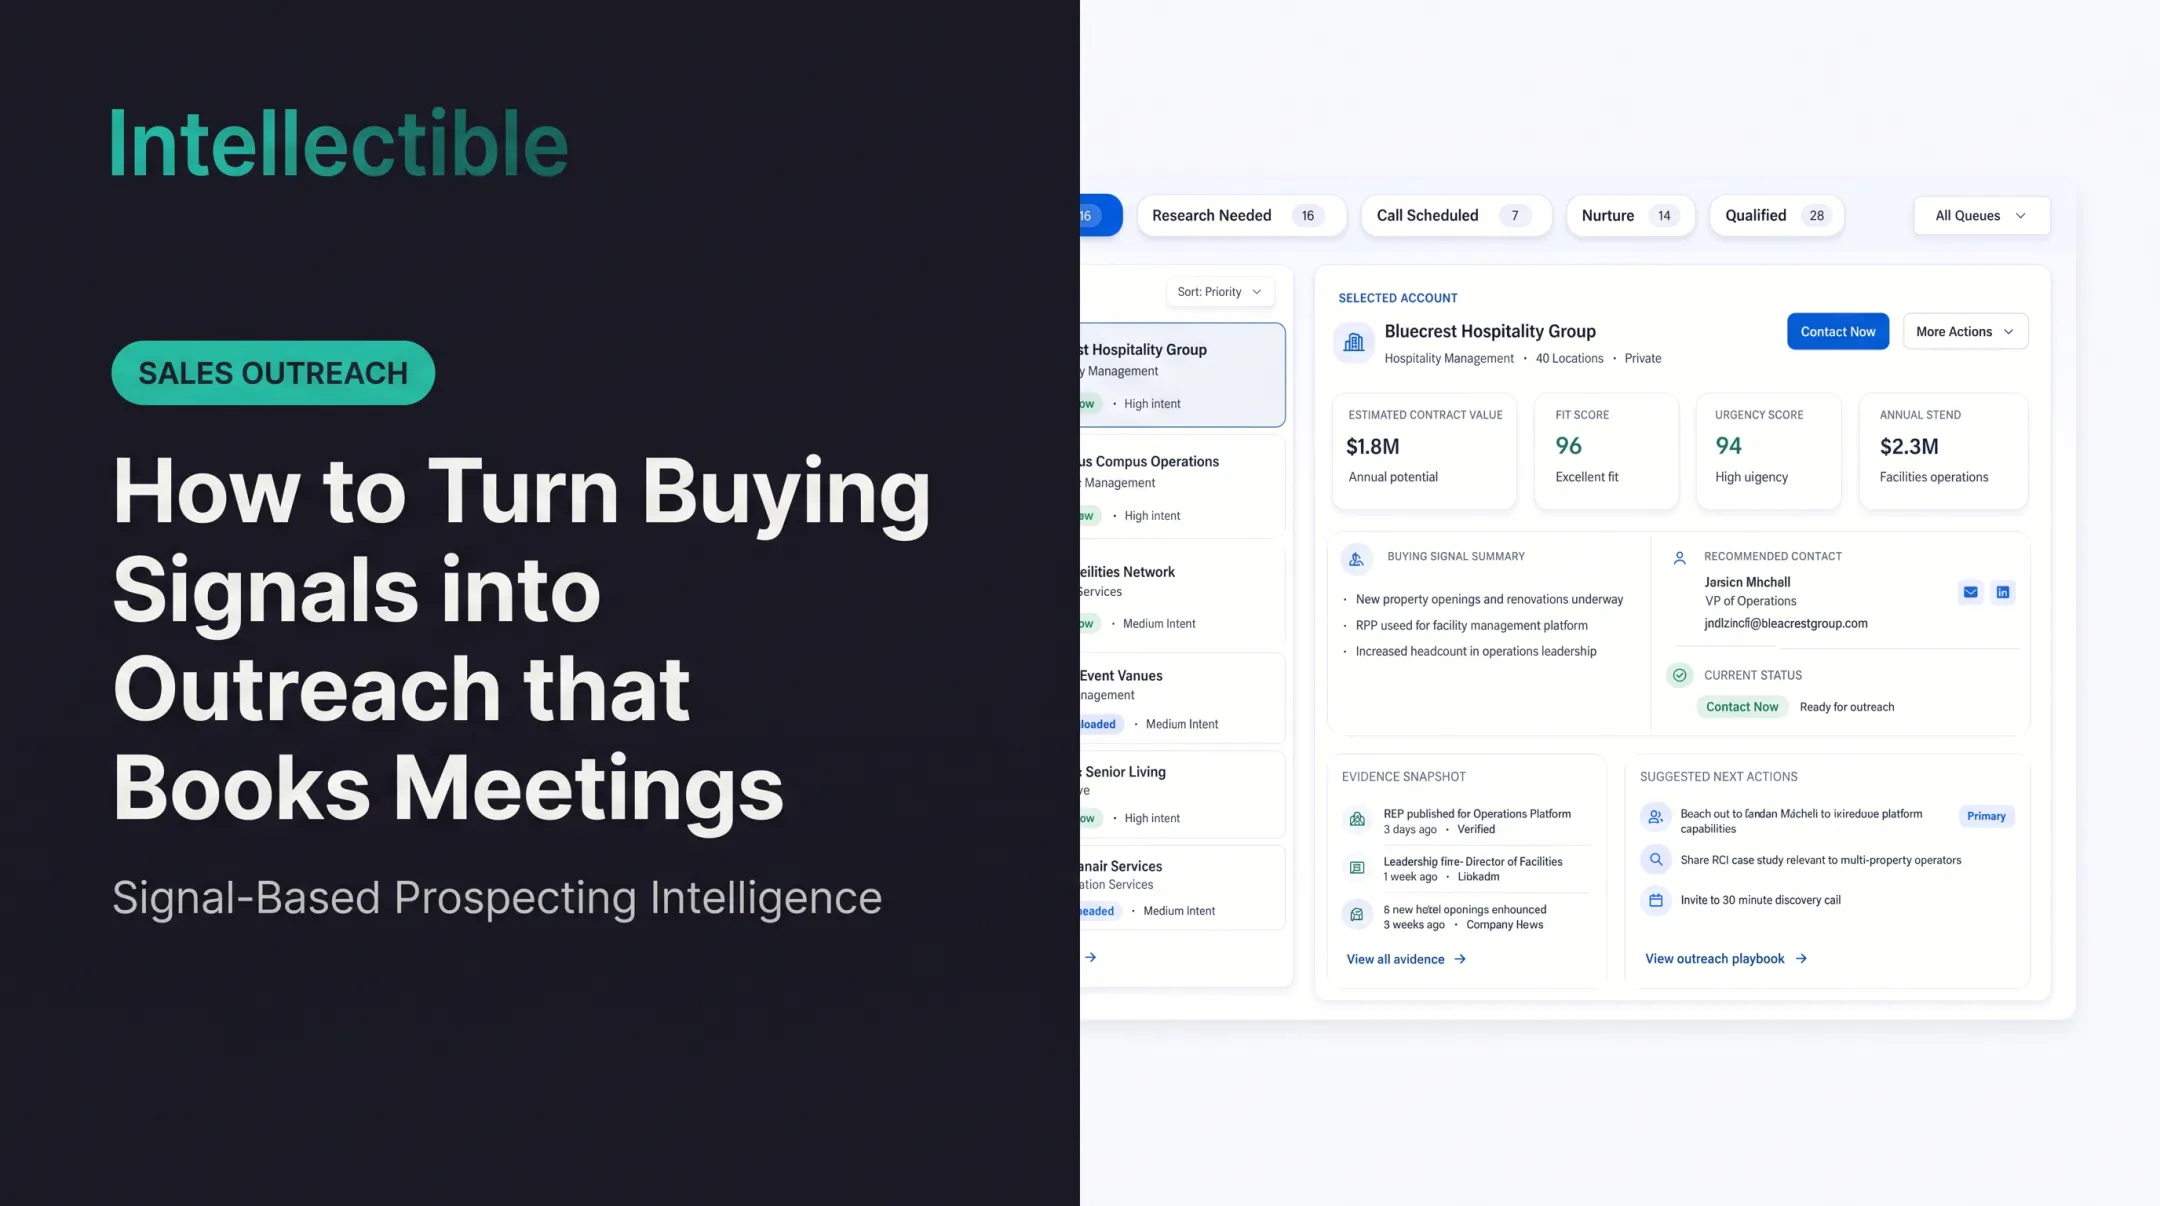
Keep people in the loop for ambiguous signals, high-value pursuits, and sensitive government or healthcare opportunities. NIST's AI Risk Management Framework similarly calls for defined roles for human oversight of AI-assisted workflows.
Avoid common measurement failures
- Don't optimize for signal volume, opens, or clicks detached from qualified conversations and pipeline.
- Prevent double counting when several signals touch one account or opportunity.
- Don't change attribution rules mid-period.
- Flag incomplete CRM updates, missing timestamps, stale stages, and inflated amounts before using the dashboard to guide investment or staffing.
Frequently Asked Questions
How should a signal be connected to a meeting?
Give each observed signal a durable identifier linked to the legal account, source, event date, signal type, and eligibility decision. Carry that identifier into the seller task, meeting, and opportunity record. Without that join, a team cannot tell which evidence led to a useful conversation.
Which metrics matter beyond alert volume?
Track acceptance rate, time to first touch, meetings per signal type, sales-accepted opportunities, and pipeline per signal cohort. Define denominators explicitly: accounts submitted for acceptance are different from all raw events collected, and meetings are different from qualified sales opportunities.
What reporting records are needed?
Use a reporting model with four related records: signal event, account review, seller action, and opportunity outcome. Store owner, disposition reason, timestamps, and source identifier at each handoff. One account can have multiple signals, so define primary attribution and supporting signals without multiplying the pipeline value.
How should pipeline attribution avoid double counting?
Separate sourced pipeline from influenced pipeline and compare similar segments and time windows. Keep unresolved attribution visible instead of assigning every deal in a signalled account to the program. Use a consistent qualification standard so marketing activity is not relabelled as a sales-accepted opportunity.
How should teams diagnose a weak signal program?
Review false positives, missed buying windows, seller rejection reasons, and slow handoffs by family and source. An alert-count increase may reflect a noisy rule; a lower volume with better acceptance and opportunity conversion may be the better operating result.
What should the measurement loop improve?
Use the reporting loop to change source selection, evidence standards, routing, and outreach preparation. Track operating time and source cost alongside outcomes. If a meeting cannot be traced to the evidence and action that created it, the system needs better instrumentation before it can claim program ROI.